Ukraine Import Data shipment information on trade between Ukraine and global countries. It also covers details of goods imported by Ukraine from nations in CIS region. Ukraine trade data is actually based on shipping bills, import bills, invoices and other import export documents. We provide Ukraine shipment data with full accuracy as we collect data from Custom Departments, Shipping & Logistics Companies, Port Authorities, Trade Associations and Government Bodies. We have Ukraine shipment data available from 2013 onwards.
Data columns covered in Ukraine import data are Date, Importer Name, Exporter Name, HS Code, Product Description, Gross Weight KG, Net Weight KG, Customs Value USD and Customs Value UAH. Here is a sample of Ukraine imports for better understanding of data format.
| Date | 02-Dec-2019 | ||
|---|---|---|---|
| Importer Name | ****** | Exporter Name | ****** |
| HS Code | 8459290000 | ||
| Product Description | International technical assistance. Equipment for the New Safe Confinement. Auxiliary equipment and devices for the main crane system. The vertical metal-cutting drilling machine 220B JDP17FM - 1 piece. | ||
| Gross Weight KG | 97 | Net Weight KG | 85 |
| Customs Value USD | 1092.708927 | Customs Value UAH | 26178.41458 |

Get connected with import companies in Ukraine.

Analyze every business activity of Ukrainian importers and their trading partners.

See how your competitors are doing business in Ukraine.

Gain insights of product demand in Ukraine.

Get 360-degree view of Ukraine business with CIS countries & global nations.

Identify new business opportunities in CIS region.
As per Ukraine import data, Ukraine’s imports totalled USD 53.9 billion in 2020, decline from USD 60.6 billion recorded in 2019. Ukraine trade data shows Ukraine was 47th importer country in the world during 2020.
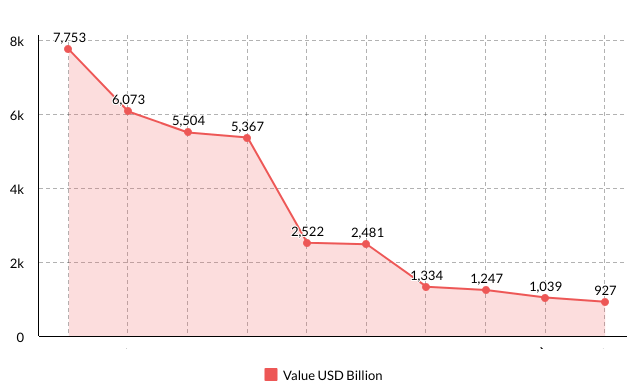
As per Ukraine import data, Ukraine’s top 10 import categories in 2020 were Mineral Fuels & Oils (14.3%), Machinery (11.2%), Vehicles (10.2%), Electrical Machinery & Equipment (9.9%), Pharmaceutical Products (4.6%), Plastics & Articles (4.6%), Miscellaneous Chemical Products (2.4%), Optical, Photographic, Medical Equipment (2.3%), Iron & Steel (1.9%) and Rubber (1.7%). Ukraine import statistics show Ukraine’s top 10 imports accounted for 63.1% to overall value of containers which entered into the country in 2020.
| Product | Value USD Million |
|---|---|
| Mineral Fuels & Oils | 7,753 |
| Machinery | 6,073 |
| Vehicles | 5,504 |
| Electrical Machinery & Equipment | 5,367 |
| Pharmaceutical Products | 2,522 |
| Plastics & Articles | 2,481 |
| Miscellaneous Chemical Products | 1,334 |
| Optical, Photographic, Medical Equipment | 1,247 |
| Iron & Steel | 1,039 |
| Rubber | 927 |
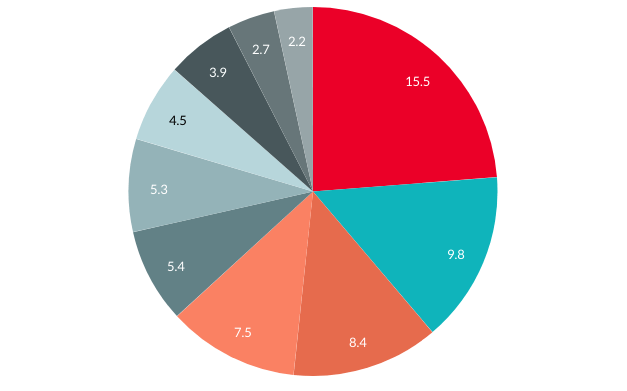
As per Ukraine import data, Ukraine’s top 10 import partners in 2020 were China (USD 8,357 million), Germany (USD 5,311 million), Russia (USD 4,542 million), Poland (USD 4,073 million), United States (USD 2,914 million), Belarus (USD 2,874 million), Turkey (USD 2,411 million), Italy (USD 2,130 million), France (USD 1,474 million) and Hungary (USD 1,192 million). Ukraine customs data shows Ukraine’s top 10 import partners accounted for 65.2% to overall value of import shipments in 2020.
| Country | Value USD % |
|---|---|
| China | 15.5 |
| Germany | 9.8 |
| Russia | 8.4 |
| Poland | 7.5 |
| United States | 5.4 |
| Belarus | 5.3 |
| Turkey | 4.5 |
| Italy | 3.9 |
| France | 2.7 |
| Hungary | 2.2 |